Data Sources We Can Help You Understand
Your business is already generating valuable data. We help you connect the dots, uncover opportunities, and make informed decisions using information you already have.
These are examples of the types of data we help businesses understand. Whether your information comes from social media, accounting software, websites, spreadsheets, CRMs, or custom systems, our goal is the same: helping you find the story behind your data.

Marketing & Social Media
📘 Facebook
📷 Instagram
💼 LinkedIn
🎵 TikTok
▶️ YouTube
📌 Pinterest
Questions we can help answer:
Which content performs best?
Is social media helping my business grow?
What types of posts generate engagement?
Are we reaching the right audience?

Google & Online Visibility
🔍 Google Business Profile
📊 Google Analytics
🔎 Google Search Console
💰 Google Ads
📍 Google Maps Insights
📞 Calls & Direction Requests
Questions we can help answer:
Are people finding us through Google?
How many customers request directions or call us?
What search terms bring people to our business?
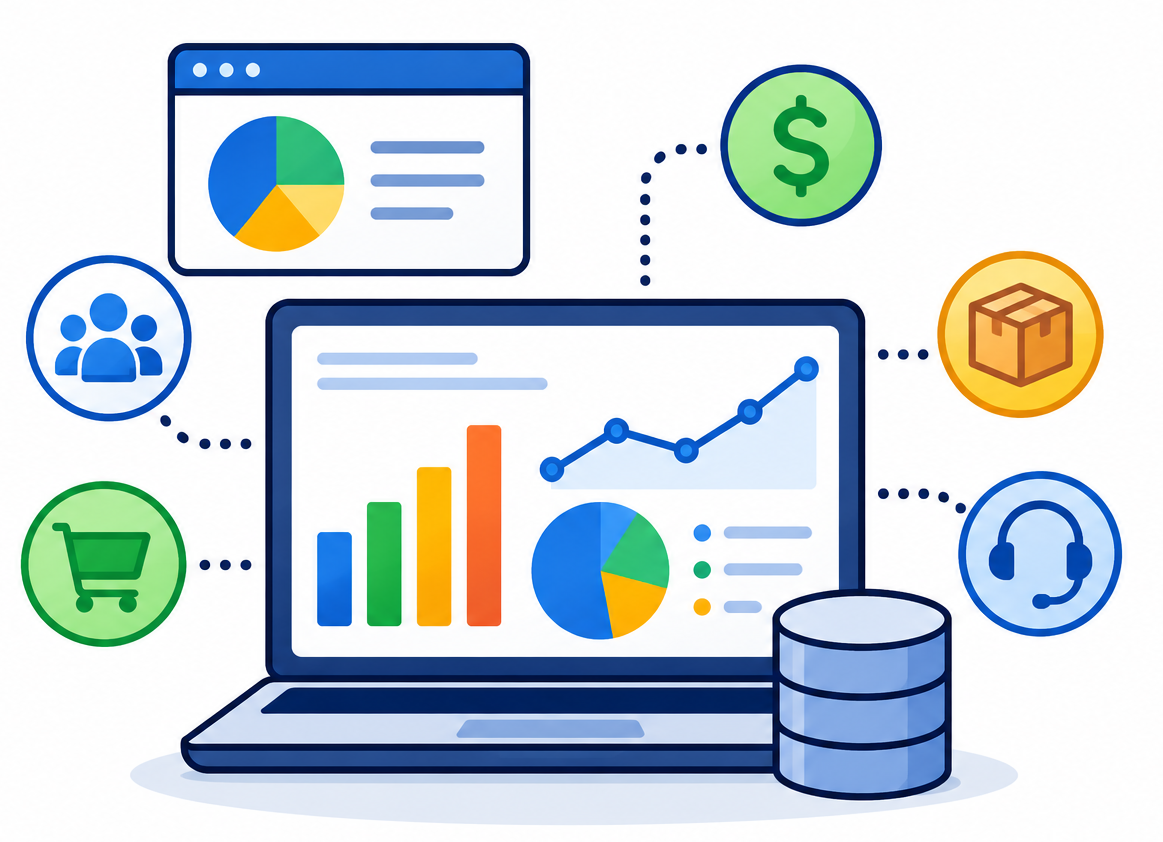
Business & Sales
📊 Excel
📈 Google Sheets
💰 QuickBooks
🛒 Point-of-Sale Systems
👥 CRM Platforms
📁 Custom Business Data
Questions we can help answer:
What products or services perform best?
Are sales trending up or down?
What seasonal patterns exist?
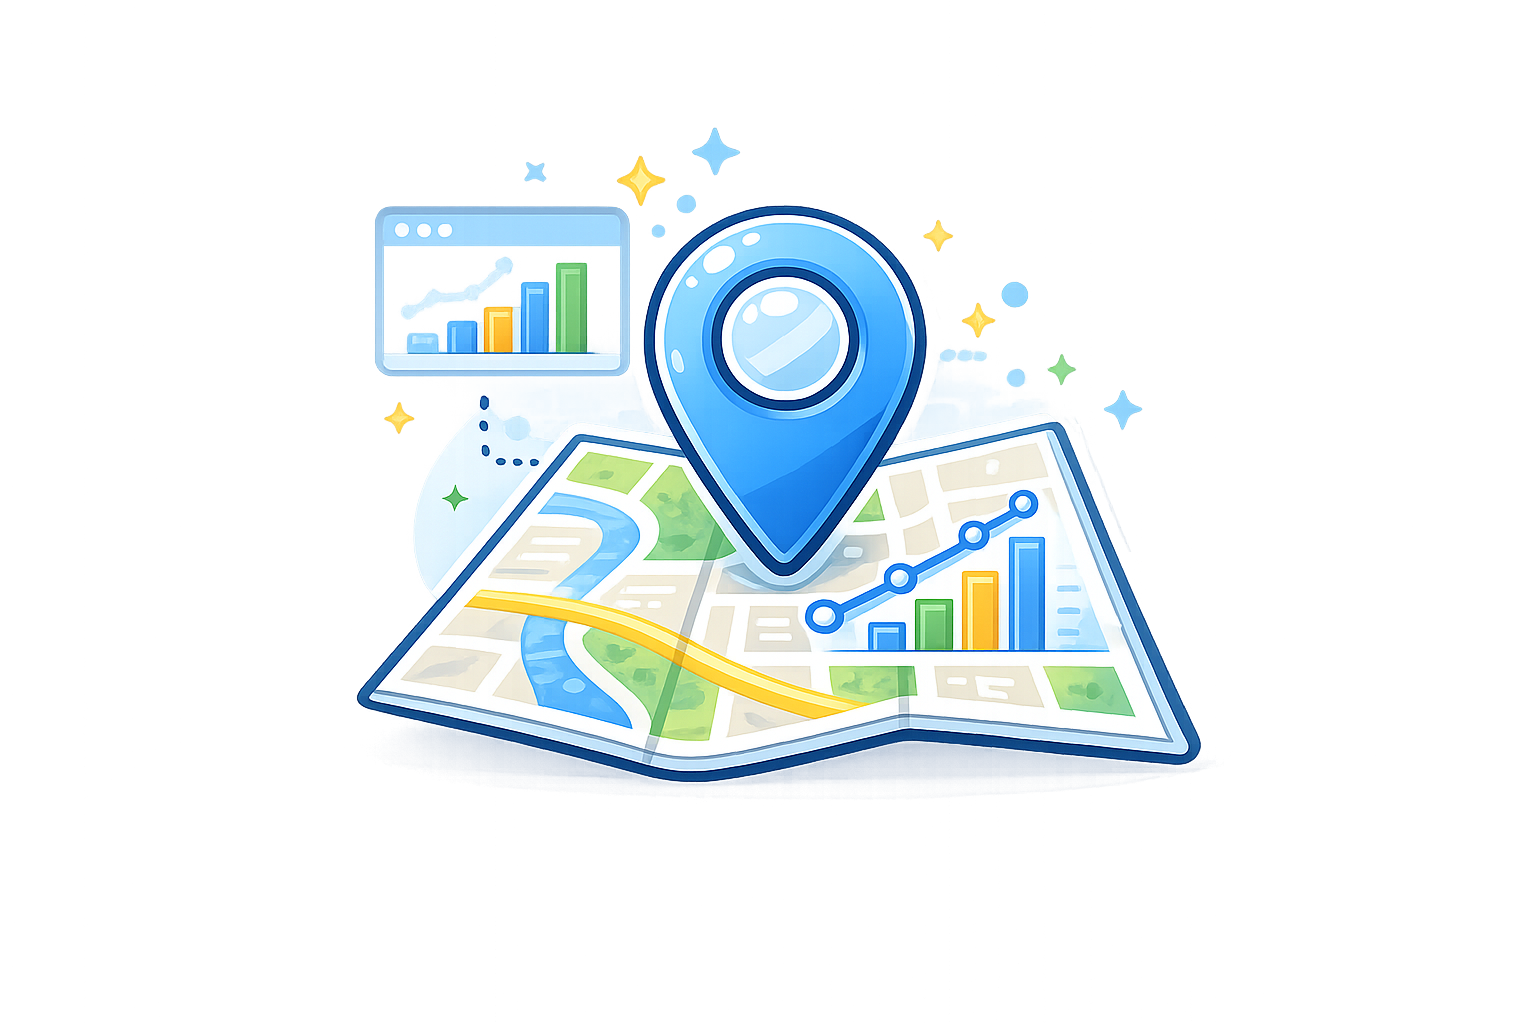
Geographic & Market Insights
📍 Geographic Data
🗺️ Service Areas
🏘️ Community Trends
🚗 Customer Travel Patterns
📊 Demographic Data
📈 Market Analysis
Questions we can help answer:
Which communities engage with our business most?
Where are opportunities for growth?
How far do customers travel to reach us?
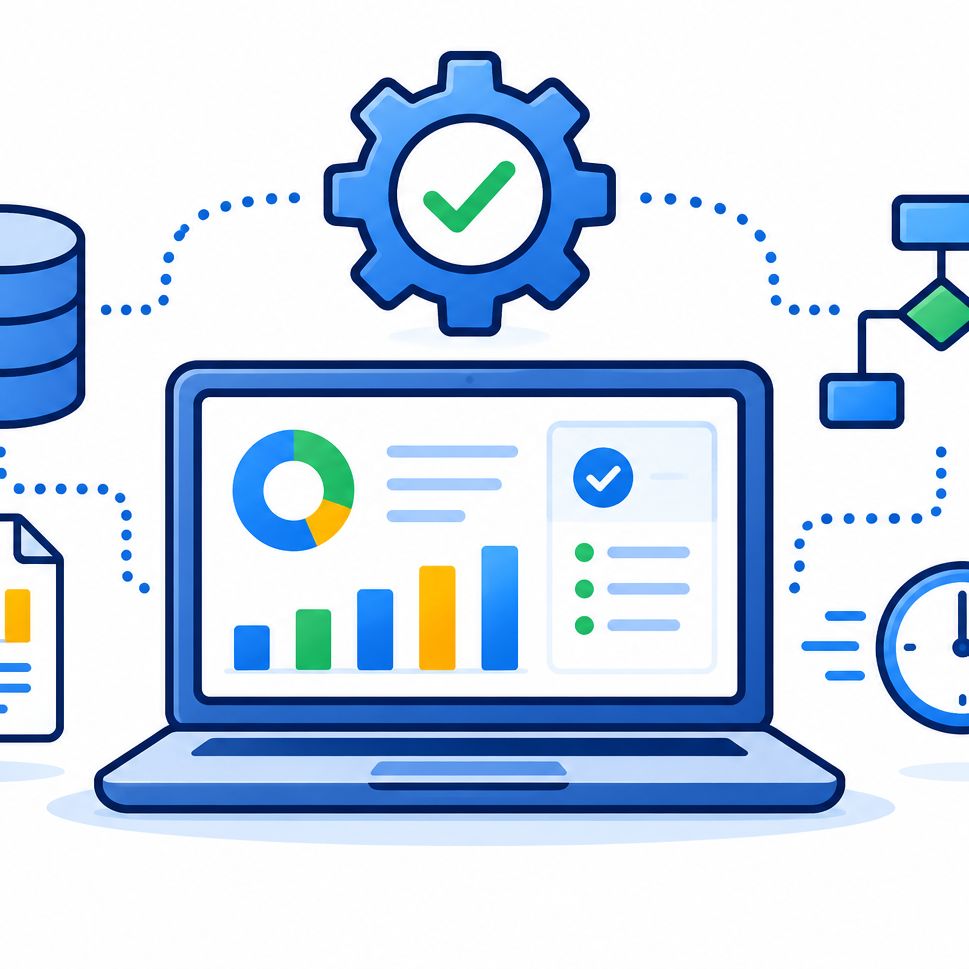
Custom Integrations
🗄️ Databases
📊 Custom Spreadsheets
🔄 Business Applications
⚙️ Automated Workflows
🔗 Third-Party Integrations
📁 Custom Data Sources
Questions we can help answer:
How can we bring all our data together?
What manual processes can be automated?
What insights are hidden across multiple systems?
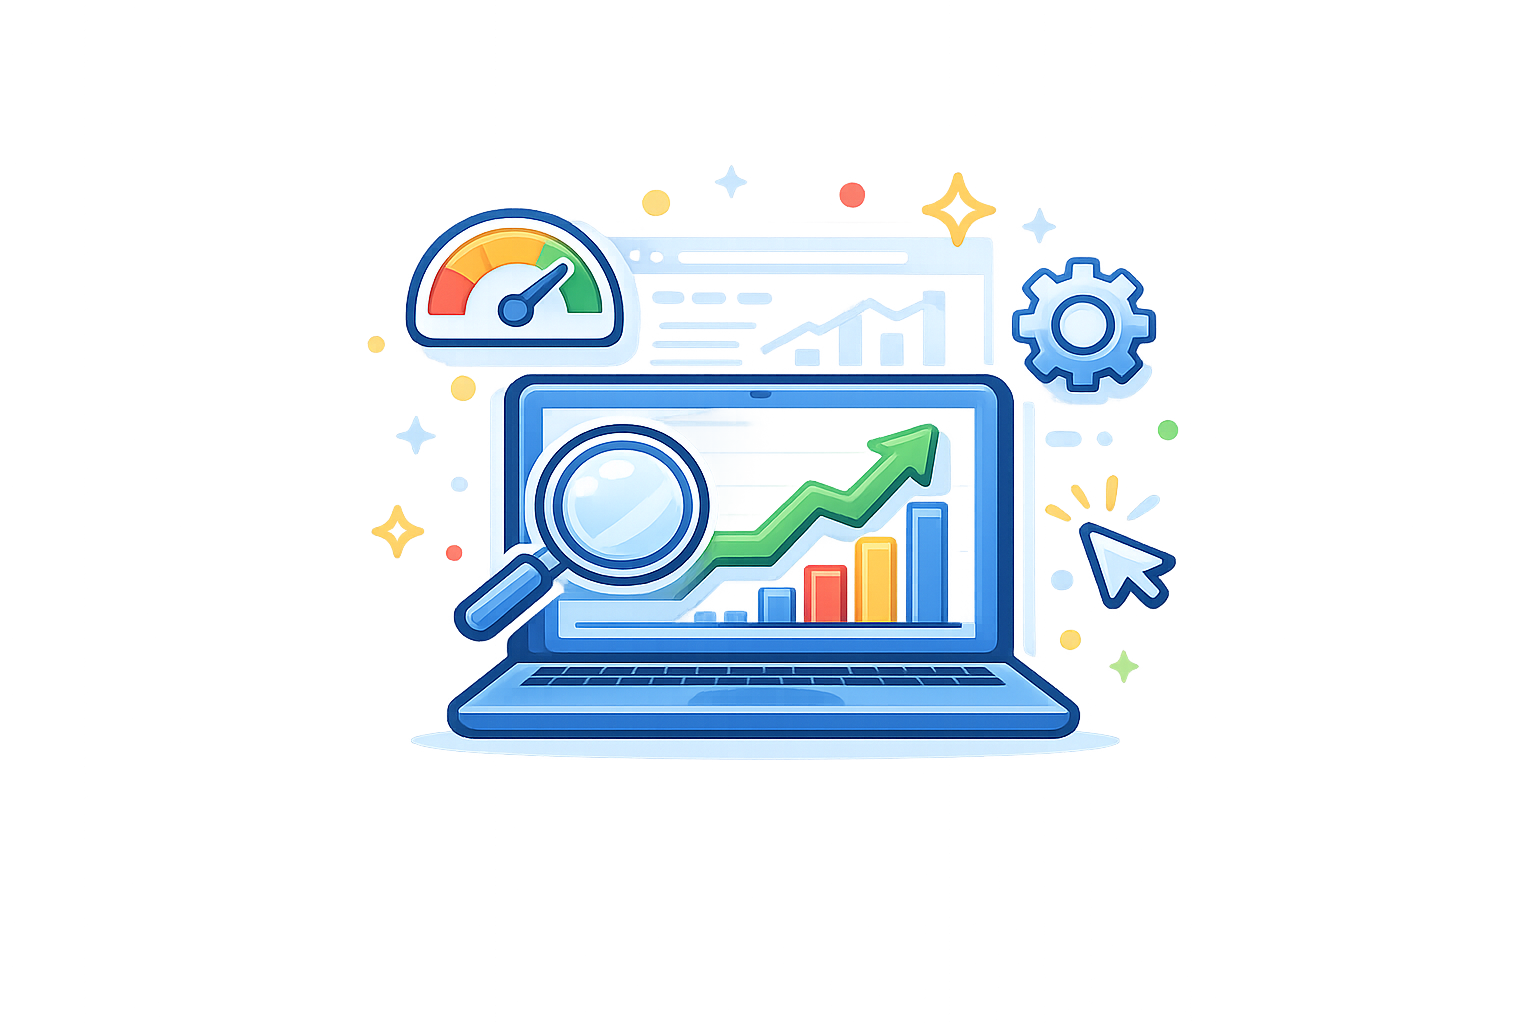
Website Performance
🌐 Website Analytics
📄 Landing Pages
👥 Visitor Behavior
🚦 Traffic Sources
Questions we can help answer:
Where do website visitors come from?
Which pages get the most attention?
Is our website turning visitors into customers?
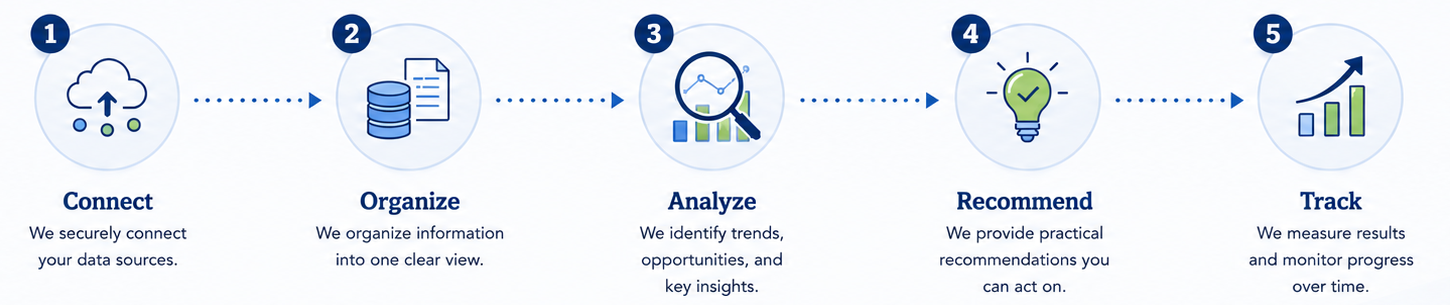
How We Turn Data Into Decisions
Find the Right Fit
Basic Briefing
Best for businesses that want a clear view of performance across key areas of their business.
See what's happening.
Monthly reporting that provides visibility into key business metrics and performance trends.
Business Insights
Best for businesses that want to understand why trends are occurring and identify opportunities for improvement.
Understand why it's happening.
Analysis that explains trends, uncovers relationships across data sources, and identifies what is driving business results.
Strategic Growth
Best for businesses that want to prioritize opportunities, growth initiatives, and support planning decisions.
Know where to focus.
Analysis and reporting designed to identify growth opportunities, prioritize areas of focus, and support data-driven business planning.
Business Intelligence
Best for businesses that want ongoing strategic guidance and support for long-term business growth.
Make confident decisions.
Business intelligence reporting and advisory services that support strategic decision-making, long-term planning, and organizational growth.